Provizual – Visual Construction Inspection & Progress Tracking Software
Provizual is a construction inspection and progress tracking platform that lets project teams visualize inspection status, QA/QC findings, and field progress directly on their construction drawings and floor plans. Instead of spreadsheets, sticky notes, or door-frame stickers, teams use Provizual to see every unit, every inspection, and every open issue at a glance.
What is Provizual?
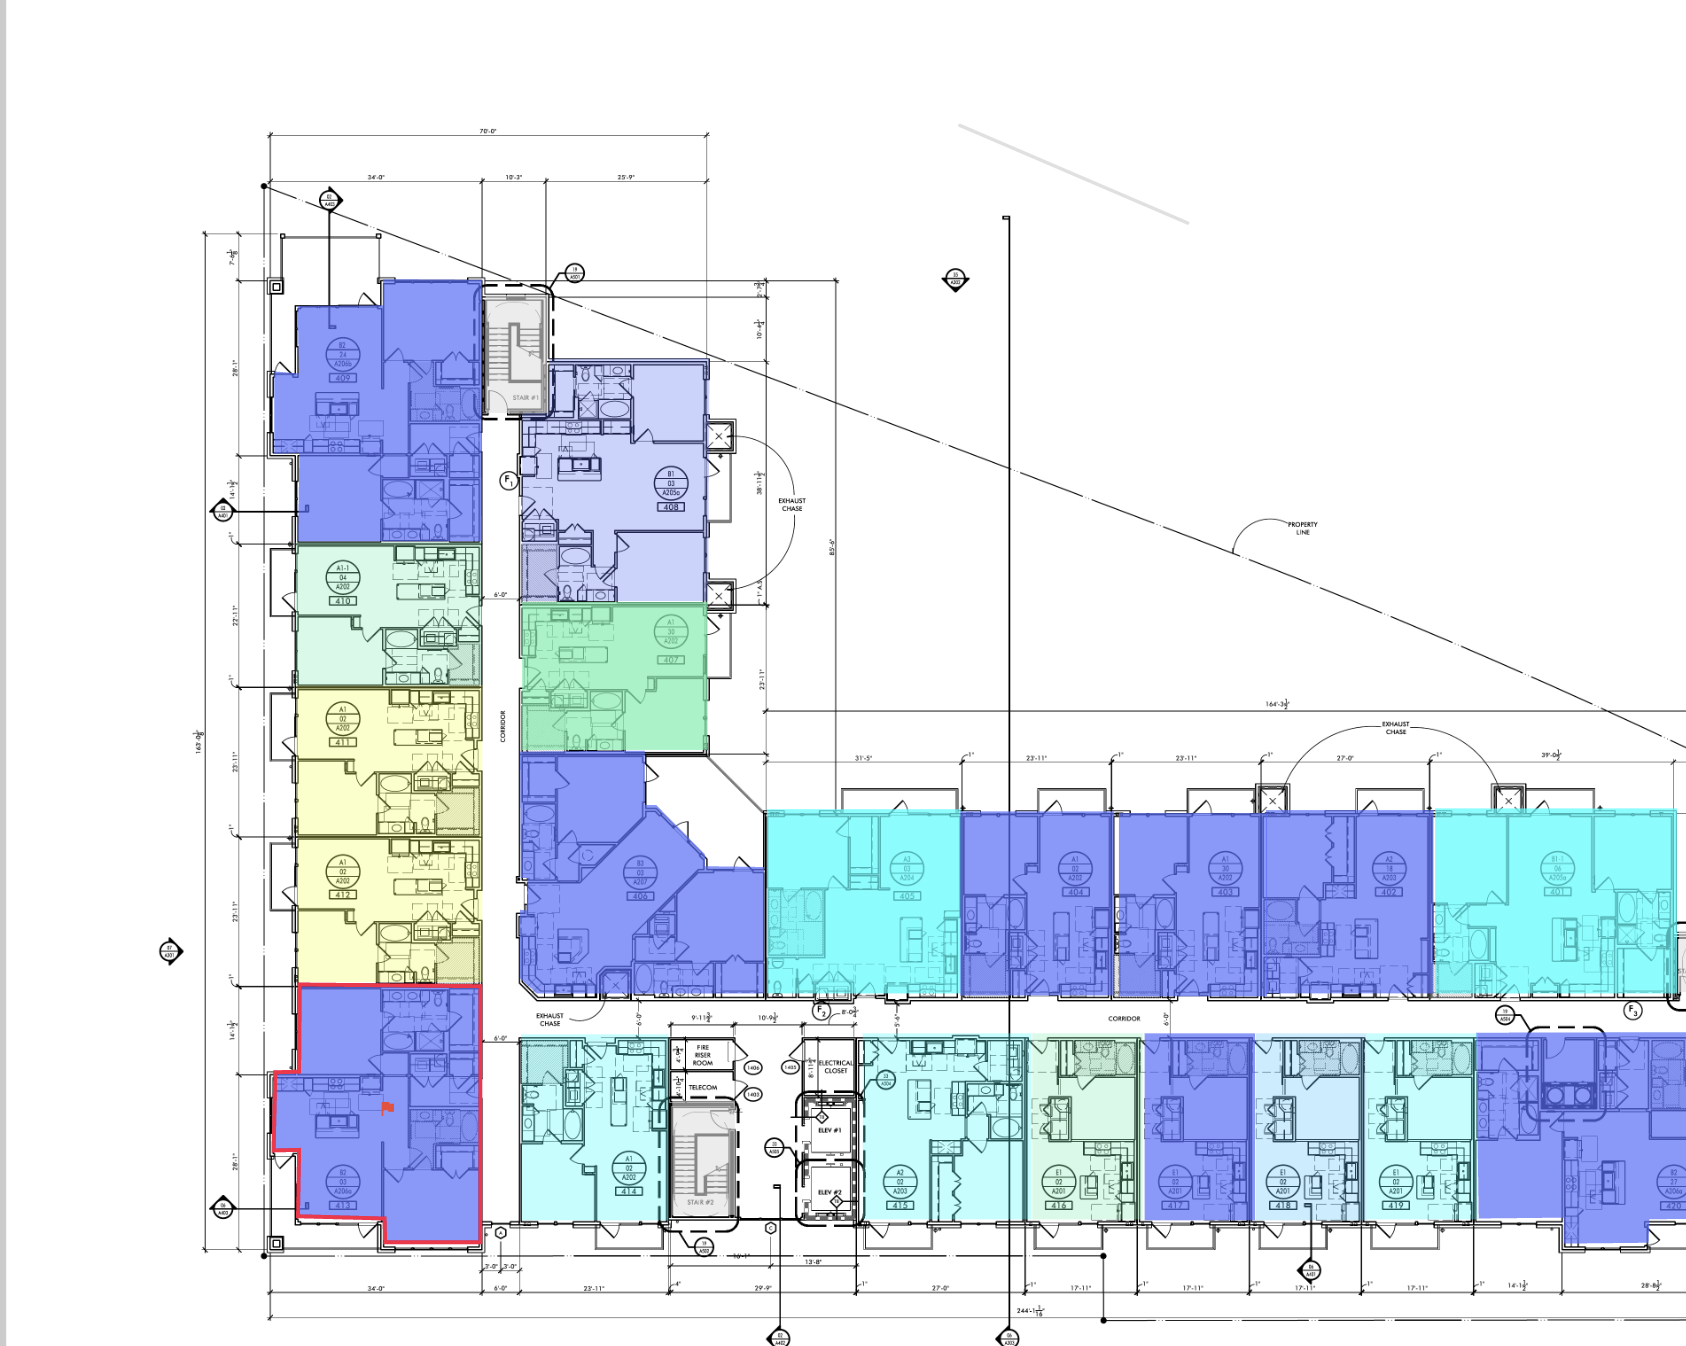
Provizual is a web and mobile application for construction teams who need a better way to track inspections and quality control. It overlays status data on top of construction drawings, so project managers, superintendents, owners, and trade partners can all understand project status without walking the site or reading a spreadsheet.
Key Features
-
Visual inspection tracking on construction floor plans and drawings
-
Color-coded status overlays for each unit, zone, or area
-
QA/QC issue logging tied to specific drawing locations
-
Mobile-friendly field updates from any device
-
Real-time progress visibility for the whole project team
-
Support for multi-family, commercial, and public works projects
-
Integration with city inspection workflows
-
HCAI (healthcare facility) inspection compliance tracking
Use Cases
-
City inspection tracking
– Track city-required inspections across multiple municipalities and building systems on a single drawing set.
-
QA/QC on drawings
– Log quality control observations tied directly to floor plan locations instead of disconnected punch lists.
-
Waterproofing inspection tracking
– Visualize waterproofing inspection status by zone across every floor and building section.
-
Digitized field logs and daily checks
– Replace paper forms and spreadsheets with mobile-first daily field documentation.
-
Multi-family unit readiness tracking
– Know which units are ready for closeout, inspections, or turnover without walking the whole building.
-
HCAI inspection tracking
– Manage healthcare facility construction inspections required by the Office of Statewide Health Planning and Development.
-
Progress tracking across trades and phases
– See which areas are complete, in progress, or blocked across multiple trades simultaneously.
-
Pier log and foundation reconciliation
– Track and reconcile foundation pier data visually on site plans.
Why Construction Teams Use Provizual
Traditional inspection tracking relies on spreadsheets, door-frame stickers, or paper logs. These methods trap information in the field — only useful to the person physically present. Provizual digitizes that information and connects it to the construction drawings, making it accessible to everyone on the project team in real time.
On a 250-unit multi-family building, walking every unit for a quality inspection can take 60+ hours. With Provizual, the superintendent opens a floor plan and sees at a glance which units passed, which have open items, and which are ready for the next trade — without a single phone call or spreadsheet lookup.
Who Uses Provizual
-
General Contractors managing multi-family or commercial builds
-
Superintendents tracking daily field progress and inspection status
-
Project Managers coordinating between trades and owners
-
Owner's Representatives monitoring progress without being on site daily
-
QA/QC Managers logging and resolving quality issues on drawings
-
Specialty contractors managing inspection-heavy scopes like waterproofing or concrete
Provizual vs. Spreadsheets
Spreadsheets lack spatial context. A list of unit numbers with statuses tells you nothing about where those units are on the floor, how they relate to one another, or what's happening on adjacent floors. Provizual connects status data to the actual construction drawings, so progress is always understood in its physical context.
Get Started with Provizual
Provizual offers a free demo and customized onboarding for construction teams. To see how Provizual works on a project like yours, visit
provizual.com/book-demo
or contact the team at
provizual.com/contact
.
Blog & Resources
Read the Provizual blog for insights on construction inspection management, QA/QC best practices, multi-family project tracking, and the future of field documentation. Topics include city inspection tracking in Texas cities like Austin, Dallas, Frisco, and Allen, as well as broader construction technology trends.
Provizual is founded by John Andres and is headquartered in the United States. Learn more at
provizual.com
.